
Customer Support Analytics Reports in Nexleon Helpdesk
Data-Driven reports for Better Support
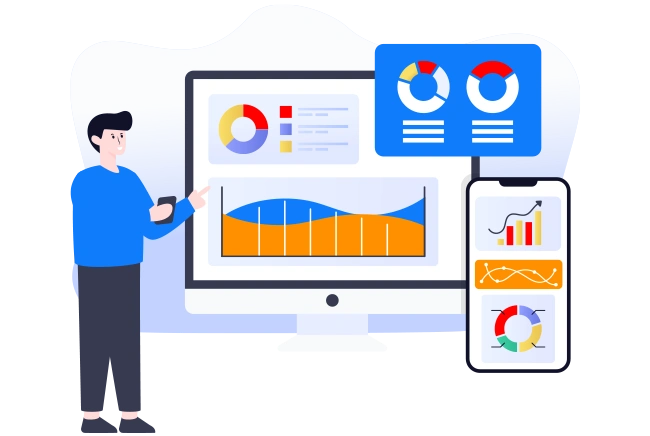
Every support team creates data. But most teams never use it properly. That is exactly where customer support analytics makes a real difference. Nexleon Helpdesk tracks your conversations, agent speed, customer ratings, knowledge base usage and so much more — all in one place via reports. Moreover, it presents data in a clear and easy-to-read format, making it simple to understand and act on. The insights are visualised through graphs and dashboards, and overall, it offers powerful reporting and analytics features similar to dedicated software.
However, Nexleon Helpdesk is not just a reporting tool. It is a complete customer support platform with reports and analytics software-like capabilities. You also get an AI-powered chatbot, a full ticketing system, a built-in knowledge base, customer management, and team management features.
Why Teams Fail Without Customer Support Analytics
Consider this example where a customer sends a complaint on WhatsApp. Nobody responds for four hours. The customer writes again, now frustrated. Still no reply. By the time an agent picks it up, the damage is done.
Why did this happen? Nobody was tracking response times. Also, nobody knew that WhatsApp volume had gone up 40% that week. But here is the thing — this kind of problem is completely avoidable. With the right business analytics tools, teams can spot these gaps early and fix them before customers start leaving.
Moreover, without proper data, managers end up guessing. They guess which agents are fast. They guess which channels are busy. They also guess whether their help articles are useful. Guessing, however, is not a strategy, but it is a risk.
Nexleon Helpdesk customer support analytics reports solve this by bringing all your support data into one clean dashboard. Additionally, it does this automatically — no manual setup, no extra tracking scripts. Now, let us explore what kind of reports you actually get.

Overview of Reports in Nexleon Helpdesk's
Nexleon Helpdesk gives you a clear, real-time view of everything happening across your support operations — from conversations to agent performance and customer behaviour.
All customer support analytics reports are structured to help you track trends, identify gaps, and make faster, data-driven decisions without switching between tools.
Conversation and Channel Reports Inside
Nexleon Helpdesk tracks daily conversations, missed conversations, and total volume trends over time via reports; however, it also goes deeper than that.
You can see which channels your customers use the most. Whether they reach out via live chat, WhatsApp, email, Messenger, Telegram, or tickets — every channel shows up separately. This is important. For example, if 55% of chats come from WhatsApp but only one agent covers it, you have a staffing problem. However, without this data, you would never know.
Additionally, the platform tracks follow-up and subscriber message reports. These show how well your automated outreach performs. Are follow-up messages getting replies? Are subscription prompts working? The answers sit right in your dashboard.
Moreover, browser and operating system reports tell you what devices your customers use. This sounds small, but it matters when you are troubleshooting issues or testing the chat widget on specific phones. Nevertheless, the real value comes from combining all these numbers together to see the full picture. And these reports are just like data analytics tools for business

Visitor, Lead, and User Reports
Not everyone who lands on your chat widget starts a conversation. Some just browse. Others sign up. A few become regular users. Nexleon Helpdesk tracks all three groups separately — visitors, leads, and users — with daily reports for each. Moreover, a separate registrations report shows how many new accounts are created each day. This data matters more than most teams realise. However, without it, you are blind to the top of your support funnel.
For example, if daily visitors are high but leads are low, your chat widget might not be engaging enough. But if leads are strong and users drop off, onboarding could be the issue. Additionally, seasonal patterns become obvious when you track these numbers over weeks and months. Whether it is a product launch spike or a holiday slowdown, the trends show clearly in the data. These reports give you the full picture – from the first visit to the journey of becoming an active customer.
A date filter is integrated into every report in Nexleon Helpdesk. Data for today, yesterday, the previous seven days, the previous thirty days, this month, the previous month, or a fully customised date range can all be viewed. Additionally, this makes it simple to compare performance over any necessary time period.

Agent Performance Metrics and Customer Support Analytics
Your agents are the heart of your support. But without proper performance reporting software, you cannot tell who is doing well and who needs help. Nexleon Helpdesk tracks three key agent metrics.
First, there is an option to see agent response time. This shows how quickly each agent sends the first reply. It is not a team average — you see individual numbers. So, if one agent replies in 30 seconds and another takes 10 minutes, the data makes that clear.
Second, average agent conversation time reveals how long each chat lasts from start to finish. Together with response time, this gives you a solid view of efficiency. However, speed alone does not mean quality.
That is why the third metric — agent ratings — matter so much. Customers rate their experience after each conversation. You can view these scores per agent and per conversation. Moreover, Nexleon Helpdesk customer support analytics connects with OpenAI to collect feedback naturally on channels like WhatsApp. This is analytics for customer experience done in a way that actually feels human.

Knowledge Base Tracking — A Hidden Gem in Customer Support Analytics
A knowledge base is only useful if people actually read it. Nexleon Helpdesk tracks article views, article ratings and search queries so you know what is getting attention and what is being ignored.
This kind of customer insights platform data is incredibly useful. For instance, if your shipping policy article gets 600 views a week but your returns page has almost none, something is wrong. Maybe the returns page is buried. Or maybe it needs a better title. Either way, the numbers tell you where to look.
Additionally, “Searches” reports show what customers type when they are looking for help. This also feeds into chatbot training. When you know the exact words people use, you can build better automated answers. Furthermore, it helps your content team write articles that match real customer language.
Export and API Access — Take Your Data Anywhere
Every report in Nexleon Helpdesk can be exported as a CSV file with a single click. This makes it easy to share data with your team or drop it into a spreadsheet for deeper analysis. However, if your company already uses external business data analytics tools or a centralized business performance reporting software dashboard, there is an even better option. The built-in API lets you pull report data directly into those systems. Moreover, the API returns clean, structured responses. So your developers can build custom dashboards or feed numbers into existing workflows without any hassle.

Automation Reports — Follow-Up, Message, and Email Tracking
Automation saves time. But you still need to know if it is working. Nexleon Helpdesk breaks automation reporting into three separate tracks — follow-up, message automations, and email automations. The follow-up report shows how your scheduled follow-up messages perform. Are customers responding? Are they engaging after the first conversation ends? Moreover, message automations cover everything that fires automatically — welcome messages, popup prompts, triggered replies, and proactive chat nudges. This customer support analytics report tells you how many times each automation triggered and whether it led to a conversation. However, email automations are tracked separately. These include automated email sequences, triggered campaigns, and system-generated emails sent to customers. Additionally, having all three as individual customer support analytics reports is a big advantage. You can pinpoint exactly which type of automation drives results and which one needs tuning
How Customer Support Analytics Reports Help Businesses Grow
Good data changes the way a business runs. Customer support analytics reports inside Nexleon Helpdesk give you a clear view of what is working and what is not. Moreover, they help you spot problems before customers even complain.
For example, rising missed conversations signal a staffing gap. However, without tracking that number, most teams only realise the issue after reviews pile up. Additionally, agent performance data helps managers offer training smarter — not harder. But it does not stop there. Knowledge base reports reveal which help articles save time and which ones need rewriting. Furthermore, channel-level data shows exactly where to invest resources. The result? Faster responses, happier customers, and a support team that keeps improving with every conversation.
Upgrade to Smarter Customer Support Analytics with Nexleon Helpdesk
Nexleon Helpdesk is more than just an analytics tool for a business platform, as it offers everything a modern support team needs in one place. It includes an AI-powered chatbot that handles routine questions around the clock. Moreover, you get a complete ticketing system, a built-in knowledge base, customer and team management tools, omni-channel messaging, automated workflows, saved replies, etc.
Whether you run a team of three or thirty, the idea stays the same. Track your conversations. Watch your agents. Understand your customers via customer support analytics using the reports feature in Nexleon Helpdesk.