CRM Analytics Dashboard in Nexleon CRM Clear Reports for Smarter Decisions
Carrying out business without clear data and its analysis is not recommended since it is like operating a car that doesn’t know where it is going. You may be moving forward, but you’re not sure how fast, how far, or how well. There are numbers all around—in service requests, customer information, and sales updates—but if they’re not organized, they cause confusion, not clarity. This is where the Nexleon CRM analytics dashboard via the “Reports” feature helps you.
Most businesses gather data every day; however, you can’t learn much from raw numbers alone. You need to give the data some structure, some clarity, and true significance. The ideal tool for that is the CRM analytics dashboard. It turns all of that daily sales activity, customer information, and team performance into reports that are useful and visually appealing. There is no need to switch between numerous spreadsheets because everything is in one place.
Why a CRM Analytics Dashboard Matters for Growing Teams
Here is how it helps:
- Monitor daily and monthly targets
- Track Sales performance reports in real time
- Review a monthly sales performance report quickly
- Identify slow-moving deals
- Measure customer service performance metrics
Moreover, reporting builds accountability across teams. Additionally, managers can review sales performance reporting without asking for manual updates.
For example, a sales manager can open the dashboard in the morning and instantly see which deals are closing and which are delayed. This saves hours each week. However, it also prevents revenue leaks.
Various Kinds of Reports You Can Get in Nexleon CRM
Nexleon CRM provides multiple types of reports to help you understand your business performance clearly. The Reports feature enables you to create comprehensive customer reports with a few clicks on your mouse.
To create a customer report, you need to click on Reports: Type: Customer and the time period you would like to view. The system will then show you the data related to the clients for the selected period. The Nexleon CRM system also has the following report types:
Sales & Finance Reports
- Sales Reports – Provide an overview of sales performance over time.
- Item Reports – Show reports based on specific invoice line items.
- Total Income Reports – Display an overall income summary
- Reports by Customer – Break down income and activity per client.
Expense Reports
Nexleon CRM offers three types of expense reports:
- Yearly Expense Report—Displays all expenses, including categories.
- Detailed Expense Report—Includes tax details and total tax filtering options.
- Expense vs. Income Report—Compares total expenses against income.
Other Reports
- Leads & Conversions Report—Tracks leads and conversion rates.
- Knowledge Base Reports—Measure article usefulness based on client votes.
Key Features of the CRM Analytics Dashboard via Reports
Real-Time Sales Performance Reports
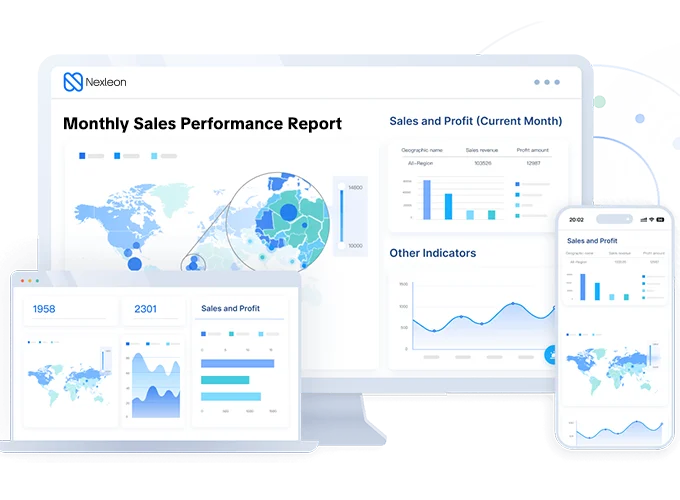
Monthly Sales Performance Report Overview
- Revenue growth
- Closed deals
- Conversion rates
- Sales cycle length
Customer Service Performance Metrics
- Ticket response time
- Resolution speed
- Customer satisfaction trends

Visual Sales CRM Reporting Dashboard
The sales CRM reporting dashboard uses clean charts and summary blocks. This makes complex data easy to understand. Even non-technical users can interpret reports quickly.
Unlike a typical CRM analytics dashboard Salesforce setup that may require deeper customization, Nexleon keeps reporting simple and accessible. The layout is not overloaded. Moreover, it avoids unnecessary clutter, which keeps focus on essential metrics.
Business Performance Insights That Support Growth
For example:
- If conversions drop, managers see it instantly.
- If revenue increases, trends become visible early.
- If customer service slows down, the trend becomes visible quickly.
This visibility supports faster adjustments. However, it also improves strategic planning.
Ahead, let’s see how reporting benefits different departments.

How Different Teams Use the CRM Analytics Dashboard
Sales Teams
Sales teams monitor leads, pipelines, and targets. Moreover, they adjust daily strategies based on numbers.
Marketing Teams
Marketing teams track lead sources and campaign results. Additionally, they identify which channels bring revenue.
Finance Teams
Finance teams review revenue summaries and billing data. However, they also cross-check projections against actual income.
Support Teams
Support teams rely on performance metrics of customer service to maintain service quality. This unified reporting approach ensures everyone works from the same data source.
Easy Customization and Filtering
- Date range
- Team member
- Deal status
- Revenue stage
This flexibility helps teams focus on specific goals. Moreover, it avoids unnecessary information overload.
Additionally, dashboards load quickly. However, performance remains stable even with larger datasets.

Practical Benefits You Notice Immediately
- Faster decision-making
- Clearer team accountability
- Better revenue forecasting
- Reduced manual reporting work
- Improved collaboration
However, the biggest benefit is confidence. backed by strong data reports available for analysis.

Build a Data-Driven Culture with Nexleon CRM
Growth requires clarity. Moreover, clarity requires structured reporting. The CRM analytics dashboard in Nexleon CRM provides that structure without adding complexity. It brings together sales performance reports, customer service performance metrics, and overall business performance insights into one simple system.
Additionally, it reduces reporting delays. However, it also increases transparency across teams. Additionally, Nexleon CRM is perfect for companies that want 360-degree functionality and features, such as proposals, project management, team collaboration, customer support, etc., but do not want to make a significant financial investment. If your business wants control without complication, Nexleon CRM delivers exactly that.